The lightweight IBM Cloud Garage Method for data science
By Romeo Kienzler Updated October 30, 2020 | Published April 8, 2019
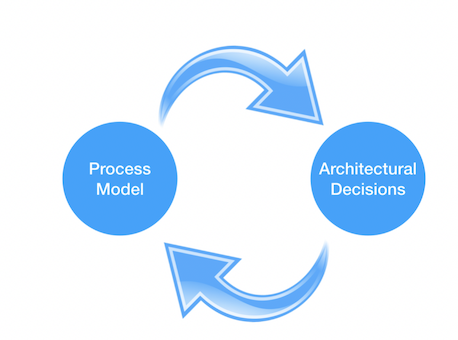
The lightweight IBM Cloud Garage Method for data science includes a process model to map individual technology components to the reference architecture. This method does not include any requirement engineering or design thinking tasks. Because it can be hard to initially define the architecture of a project, this method supports architectural changes during the process model. A separate companion article discusses the architectural decision guidelines.
The lightweight IBM Cloud Garage Method for data science process model
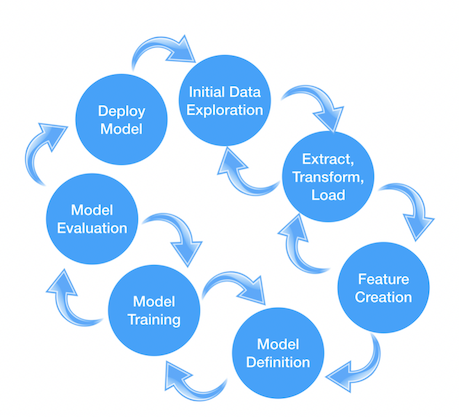
This section introduces this lightweight process model.
The first thing that you should notice is the similarity to the process models I introduced in my last article. With this model, there are no design tasks because this method is used for projects where the business expectations are already set. Finally, you should notice the increased granularity in the individual tasks. The reason for this is reuse. Every task has a clear purpose and a defined work product (for example, a Jupyter Notebook, a script, or a docker container hosting a scoring or training endpoint, depending on the architectural decisions made).
The following sections explain the individual tasks.
Initial data exploration
This task is crucial for understanding your data. Data quality is the most important driver for success in any data science project. So, this task lets you address data quality from the beginning. This includes going back to the data owners and asking them for better quality data, if applicable.
Extract, transform, load (ETL)
This task is an important step in transforming the data from the source system into data suitable for analytics. In traditional data warehousing, this process includes accessing the online transaction processing (OLTP) system's databases, transforming the data from a highly normalized data model into a Star or Snowflake Schema, and storing the data to a data warehouse. In data science projects, this step is usually much simpler. The data arrives in an exported format (for example, JSON or CSV). But, sometimes de-normalization must be done as well. The result usually ends up in a bulk storage like Cloud Object Store.
Feature creation
This task transforms input columns of various relations into additional columns to improve model performance. A subset of those features can be created in an initial task (for example, one-hot encoding of categorical variables or normalization of numerical variables). Some others require business understanding or multiple iterations to be considered. This task is one of those benefiting the most from the highly iterative nature of this method.
Model definition
This task defines the machine learning or deep learning model. Because this is a highly iterative method, various iterations within this task or including up- and downstream tasks are possible. I recommend starting with simple models first for baseline creation after those models are evaluated.
Model training
This task trains the model. The task is set apart from model definition and evaluation for various reasons. First, training is a computationally intense task that might be scaled on computer clusters or GPUs. Therefore, an architectural cut is sometimes unavoidable. (For example, model definition happens in Keras, but training happens on a Keras model export using Apache SystemML on top of Apache Spark running on a GPU cluster.) In hyperparameter tuning and hyperparameter space exploration, the downstream task "Model Evaluation" can be part of this asset.
Model evaluation
This task evaluates the model's performance. Given the nature of the task, different metrics must be applied, for example, categorical-cross entropy for a multi-class classification problem. It's important to divide the data set into training, test, and validation (if cross-validation isn't used) and keep track of the performance of different feature engineering, model definition, and training parameters.
Model deployment
This task deploys the model. The task depends heavily on the use case, especially, on the stakeholder's expectation on consuming the data product. So, valid ways of deployment include:
An interactive Jupyter Notebook
An export of an already run, static Jupyter Notebook or some type of report
A REST endpoint allowing scoring (and training) of the model (for example, backed by a docker container running on Kubernetes)
A full-fledged web or mobile application
Naming convention
Need a structure to name your assets? Here's our recommended convention. Note that we recommend to always use project_name, while the others are optional.
This article information on the lightweight IBM Cloud Garage Method for data science. It included a process model to map individual technology components to the reference architecture. A separate companion article discusses the architectural decision guidelines.
Open data is a very big movement and we want to encourage you to use open data for your project. But you are of course also allowed to use data from another source, including your company’s data. Finally, you are also allowed (although we don’t really encourage you to do so) to create a test data generator / simulator in case you want to support an interesting use case but can’t get hold of relevant data.
Please take a moment and search for an open data set of your interest. Have a brief look at the data and decide on the use-case you want to implement.
Once you've identified a Use Case and Data Set it is time to get familiar with data. In the process model this task is called Initial Data Exploration. Please take a minute or two to (re)visit the following lecture
Given the lectures above, please create statistics and visualization on your Data Set to identify good columns for modeling, potential data quality issues and anticipate potential feature transformations necessary.
Create a jupyter notebook where you document your code and include visualizations as first deliverable. Please also stick to the naming conventions explained in the the process model manual.
- Assess feature quality – how relevant is a certain measurement (e.g. use correlation matrix)
- Get an idea on the value distribution of your data using statistical measures and visualizations
Architectural Decisions Document (ADD)
As the process model is paired with architectural decision guidelines in an iterative fashion one of the deliverables is an architectural decisions document containing the technology mapping between architectural components and concrete technologies. In addition to the mapping, a justification for the decision of the mapping is required so that resources entering the project at a later stage can retrace the thinking threads of current project decision makers.
Please use the template provided below and start filling the gaps in the document. As the whole process model is iterative, it is favored behavior if this document evolves during the creation of the capstone deliverables.
Each step (stop) in the process model comes with a set of guidelines. Please make sure you check them out on the link below and also document any decisions you've made (using the guidelines or your experience or both) as comments/documentation in your deliverables (e.g. jupyther notebooks).
Keeping source and documentation as tight as possible is highly recommended. So please make use of comments in the code directly and in sections above and below the code.
And please keep in mind, good software projects have as much documentation in the code as actual code itself.
Following the guidelines will lead to decisions and hopefully to some good comments in and above the code so that a follow-up data scientists understand what you've done.
ETL is one of the first things which needs to be done in a data science project. The nature of this task highly depends on the type of data source. Whether it is relational or unstructured, enterprise data or internet data, persistent data or streaming data. This heavily influences the choice of architecture. Therefore, you must document your choice and thinking process in the Architectural Decision Document (ADD).
This task involves – as the name implies – accessing the data source, transforming it in a way it can be easily worked with and finally make it available to downstream analytics processes – either real-time streaming or batch ones.
In case of operational relational data, de-normalization usually needs to take place, for unstructured data, some feature extraction might already be appropriate and for real-time data, windows are usually created.
Please create an ETL process, document it and save this deliverable according to the naming convention of the process model.
In some process models Data Cleansing is a separate task, it is closely tied to Feature Creation but also draws findings from the Initial Data Exploration task. The actual data transformations are implemented in the Feature Creation asset deliverable; therefore, Data Cleansing is part of the Feature Creation task in this process model.
While tuning machine learning models, this deliverable asset is touched on a regular basis anyway because features need to be transformed to increase model performance. In such iterations, often issues with data are detected and therefore need to be corrected/addressed here as well.
The following none exhaustive list gives you some guidelines:
· Data types Are data types of columns matching their content? E.g. is age stored as integer and not as string?
· Ranges Does the value distribution of values in a column make sense? Use stats (e.g. min, max, mean, standard deviation) and visualizations (e.g. box-plot, histogram) for help
· Emptiness Are all values non-null where mandatory? E.g. client IDs
· Uniqueness Are duplicates present where undesired? E.g. client IDs
· Set memberships Are only allowed values chosen for categorical or ordinal fields? E.g. Female, Male, Unknown
· Foreign key set memberships Are only allowed values chosen as field? E.g. ZIP code
· Regular expressions Some files need to stick to a pattern expressed by a regular expression. E.g. a lower-case character followed by 6 digits
· Cross-field validation Some fields can impact validity of other fields. E.g. a male person can’t be pregnant
Please transform your data set accordingly and add all code to the Feature Creation asset deliverable. Please comply with the naming convention documented in the process model.
Feature Creation and Feature Engineering is one of the most important tasks in machine learning since it hugely impacts model performance. This also holds for deep learning, although to a lesser extent. Features can be changed or new features can be created from existing ones
The following none exhaustive list gives you some guidelines for feature transformation:
· Imputing Some algorithms are very sensitive to missing values. Therefore, imputing allows for filling of empty fields based on its value distribution
· Imputed time-series quantization Time series often contain streams with measurements at different timestamps. Therefore, it is beneficial to quantize measurements to a common “heart beat” and impute the corresponding values. This can be done by sampling from the source time series distributions on the respective quantized time steps
· Scaling / Normalizing / Centering Some algorithms are very sensitive differences in value ranges for individual fields. Therefore, it is best practice to center data around zero and scale values to a standard deviation of one
· Filtering Sometimes imputing values doesn’t perform well, therefore deletion of low quality records is a better strategy
· Discretizing Continuous fields might confuse the model, e.g. a discrete set of age ranges sometimes performs better than continuous values, especially on smaller amounts of data and with simpler models
The following none exhaustive list gives you some guidelines for feature creation:
· One-hot-encoding Categorical integer features should be transformed into “one-hot” vectors. In relational terms this results in addition of additional columns – one columns for each distinct category
· Time-to-Frequency transformation Time-series (and sometimes also sequence data) is recorded in the time domain but can easily transformed into the frequency domain e.g. using FFT (Fast Fourier Transformation)
· Month-From-Date Creating an additional feature containing the month independent from data captures seasonal aspects. Sometimes further discretization in to quarters helps as well
· Aggregate-on-Target Simply aggregating fields the target variable (or even other fields) can improve performance, e.g. count number of data points per ZIP code or take the median of all values by geographical region
As feature engineering is an art on itself, this list cannot be exhaustive. It’s not expected to become an expert in this topic at this point. Most of it you’ll learn by practicing data science on real projects and talk to peers which might share their secrets and tricks with you.
Please transform your data set accordingly and add all code to the Feature Creation asset deliverable. Please comply with the naming convention documented in the process model.
Now it’s time to start modelling. So, this is where it really depends on your use case and data set how you want to proceed. For example, if you are in an unsupervised context you can choose between an auto-encoder, PCA or clustering. Or if you are in a supervised context you have choice between different state-of-the-art machine learning and deep learning algorithms. But here are some guidelines which are required to follow:
Choose, justify and apply a model performance indicator (e.g. F1 score, true positive rate, within cluster sum of squared error, …) to assess your model and justify the choice of an algorithm
Implement your algorithm in at least one deep learning and at least one non-deep learning algorithm, compare and document model performance
Apply at least one additional iteration in the process model involving at least the feature creation task and record impact on model performance (e.g. data normalizing, PCA, …)
Depending on the algorithm class and data set size you might choose specific technologies / frameworks to solve your problem. Please document all your decisions in the ADD (Architectural Decisions Document).
Once you think you have achieved a descent model performance save the notebook according to the process model’s naming convention and proceed to the model training task.
Once your model is defined, it can be trained. This can happen on a single thread or on a parallel framework like Watson Machine Learning or Apache Spark. In the most simple case Model Definition and Model Training is just a couple of LOCs (lines of code) away. In the case of Watson Machine Learning or Apache Spark models might need to get serialized and transferred to another technology / framework.
Please specify and justify the technologies used for model definition and training in the ADD.
Once you think you have achieved a descent model performance save the notebook according to the process model’s naming convention and proceed to the model evaluation task.
Discussion Promt Week 3
How is your model performing? Have you already tried to measure model performance? If so, how? Do you think you will be able to improve model performance? If so, what are your plans to do so?
Week 4 - Model Evaluation, Tuning, Deployment and Documentation
Learning Objectives
Evaluate performance of a model
Generate a data product which is consumable by business stakeholders
Model evaluation is a critical task in data science. This is one of the few measures business stakeholders are interested in. Model performance heavily influences business impact of a data science project. Therefore, it is important to take some time apart in an independent task in the process model.
So how are models evaluated? In supervised machine learning this is relatively straightforward since you can always create a ground truth and compare your results against ground truth.
So, we are either splitting data into training-, test- and validation-sets to assess model performance on the test set or we use cross validation. This all is explained in the following coursera course https://www.coursera.org/learn/advanced-machine-learning-signal-processing/ Week 2.
In case we know what data set we can use as ground truth in supervised learning (classification and regression) we need to define a different measure for evaluation than in unsupervised learning (clustering). Since it depends on the type of model we create, the following none exhaustive lists can be used as a starting point for further research:
Please choose at least one appropriate model performance measure, justify why you’ve used it and document how iterative changes in the feature creation task influence it.
Model deployment comes in many shapes. The key to everything is that the business insights that result from the model are made available to stakeholders. This can happen in various ways. At the simplest level a PDF report is generated (e.g. using a jupyter notebook in Watson Studio) and handed over to business stakeholders. Alternatively, the model is encapsulated behind a REST API and made either available to be consumed by a data product or sold internally or externally as a API (e.g. by using IBM Watson Machine Learning or Fabric for DeepLearning).
Depending on your use case, please choose and implement an appropriate model deployment option and justify your decisions in the ADD.
Data Product (optional)
The final delivery of most of the data science projects are data products. Depending on who your stake holders are this might include a formal report document, a bunch of charts with captions, a trained and deployable model or a complete application.
Although not mandatory for this project, you might want to consider implementing (and also showcasing) a data product. Here a incomplete list of technologies you might want to use:
NodeRED dashboards
AngularJS/D3 web application
Create ADD - Architectural Decisions Document
During the curse of the project you’ve made several choices which impact the project. Now it’s time to do a final pass on the document and make sure everything is in shape. Please spend some time on it to really make sure everything is consistent. Imagine, that your successor needs to continue with your project without being able to speak to you, so this document is the only way to understand why and how things are implemented as they are.
Creating your data product is an important skill. But the stakeholders are paying you. If they are happy, you are happy. If you are employed, happy stakeholders justify your head count. If you are working independently, happy clients ensure follow up orders and if you are in research, your stakeholders are the readers of your publications.
So, in this exercise we want to make sure you have sufficient presentation skills. And since digital eminence is one of the key factors of success for data scientists we encourage you to put your presentation publicly on YouTube.
(If you REALLY don't like to, just upload it as UNLISTED - if you have any concerns, please contact us using the discussion forum)
So here is what you need to do.
1. Create a presentation targeted at stakeholders introducing
a) the data set
b) the use case
c) the solution to the use case (e.g. your report/notebook, deployed model or data product)
2. Create a presentation targeted at your data science peers introducing
a) your architectural choices
b) your data quality assessment, data pre-processing and feature engineering
c) your model performance indicators
d) your model algorithm
3. Record a 5-10 minute presentation with the following requirements
a) You should be visible in the video, at a minimum at the introduction and at the end
b) The presentations from step 1 and 2 should be visible
c) Your solution to the use case should be demonstrated and recorded during the video
d) Put this video to your Youtube channel and name it as follows
IBM Coursera Advanced Data Science Capstone – YOUR NAME
Discussion Promt Week 4
Have you able to improve your model performance? How did you measure? What have you done? What gave you the biggest boost in performance?