In real/ideal world, start with specific question and find data to answer it:
What’s a Community District?
import pandas as pd

# Display more rows and columns in the DataFrames
pd.options.display.max_columns = 100
pd.options.display.max_rows = 100
# Read the ZIP codes in as strings
url = "https://storage.googleapis.com/python-public-policy/data/311_requests_2018-19_sample_clean.csv.zip"
requests = pd.read_csv(url, dtype={"Incident Zip": "string"})

# find valid ZIP codes
valid_zips = requests["Incident Zip"].str.contains(r"^\d{5}(?:-\d{4})?$")

# filter the DataFrame to only invalid ZIP codes
invalid_zips = valid_zips == False
requests_with_invalid_zips = requests[invalid_zips]
requests_with_invalid_zips["Incident Zip"]
C:\Users\alfre\AppData\Local\Temp\ipykernel_23004\197807419.py:3: DtypeWarning: Columns (20,31,34) have mixed types. Specify dtype option on import or set low_memory=False.
  requests = pd.read_csv(url, dtype={"Incident Zip": "string"})
55017     HARRISBURG
58100         N5X3A6
80798         100000
120304           IDK
123304          1801
173518     14614-195
192034        979113
201463           100
207158          8682
216745        000000
325071      NJ 07114
425985          1101
441166         DID N
Name: Incident Zip, dtype: string
#Clear any invalid ZIP codes:
requests.loc[invalid_zips, "Incident Zip"] = None
General data cleaning tips:
# count of 311 requests per Community District
cb_counts = requests.groupby("Community Board").size().reset_index(name="num_311_requests")
cb_counts = cb_counts.sort_values("num_311_requests", ascending=False)
cb_counts.head()
| Community Board | num_311_requests | |
|---|---|---|
| 50 | 12 MANHATTAN | 14110 |
| 23 | 05 QUEENS | 12487 |
| 51 | 12 QUEENS | 12228 |
| 2 | 01 BROOKLYN | 11863 |
| 12 | 03 BROOKLYN | 11615 |
Hypothesis: Population size may help explain the variance
We can combine the counts per community district dataset with population data for each community district.
We’ll use pandas’ .merge(), comparable to:
In general, called “record linkage” or “entity resolution”.
#Let’s load the population dataset and check out its contents

# data source: https://data.cityofnewyork.us/City-Government/New-York-City-Population-By-Community-Districts/xi7c-iiu2/data
population = pd.read_csv("https://data.cityofnewyork.us/api/views/xi7c-iiu2/rows.csv")
population.head()
| Borough | CD Number | CD Name | 1970 Population | 1980 Population | 1990 Population | 2000 Population | 2010 Population | |
|---|---|---|---|---|---|---|---|---|
| 0 | Bronx | 1 | Melrose, Mott Haven, Port Morris | 138557 | 78441 | 77214 | 82159 | 91497 |
| 1 | Bronx | 2 | Hunts Point, Longwood | 99493 | 34399 | 39443 | 46824 | 52246 |
| 2 | Bronx | 3 | Morrisania, Crotona Park East | 150636 | 53635 | 57162 | 68574 | 79762 |
| 3 | Bronx | 4 | Highbridge, Concourse Village | 144207 | 114312 | 119962 | 139563 | 146441 |
| 4 | Bronx | 5 | University Hts., Fordham, Mt. Hope | 121807 | 107995 | 118435 | 128313 | 128200 |
# create a common ID in each
# create a borocd column in cb_counts dataframe
cb_counts.head()
| Community Board | num_311_requests | |
|---|---|---|
| 50 | 12 MANHATTAN | 14110 |
| 23 | 05 QUEENS | 12487 |
| 51 | 12 QUEENS | 12228 |
| 2 | 01 BROOKLYN | 11863 |
| 12 | 03 BROOKLYN | 11615 |
def recode_borocd_counts(row):
    if "MANHATTAN" in row["Community Board"]:
        return "1" + row["Community Board"][0:2]
        # [0:2] provides the first 2 characters, i.e. characters at indexes 0 and 1.
        # you could also use [:2] without the zero.
    elif "BRONX" in row["Community Board"]:
        return "2" + row["Community Board"][0:2]
    elif "BROOKLYN" in row["Community Board"]:
        return "3" + row["Community Board"][0:2]
    elif "QUEENS" in row["Community Board"]:
        return "4" + row["Community Board"][0:2]
    elif "STATEN ISLAND" in row["Community Board"]:
        return "5" + row["Community Board"][0:2]
    else:
        return "Invalid BoroCD"
sample_row = cb_counts.iloc[0]
sample_row
Community Board     12 MANHATTAN
num_311_requests           14110
Name: 50, dtype: object
recode_borocd_counts(sample_row)
'112'
cb_counts["boro_cd"] = cb_counts.apply(recode_borocd_counts, axis=1)
apply() (the way we’re using it) takes a function and runs it against each row of a DataFrame, returning the results as a Series
axis=1 specifies that you want to apply the function across the rows instead of columns
cb_counts
| Community Board | num_311_requests | boro_cd | |
|---|---|---|---|
| 50 | 12 MANHATTAN | 14110 | 112 |
| 23 | 05 QUEENS | 12487 | 405 |
| 51 | 12 QUEENS | 12228 | 412 |
| 2 | 01 BROOKLYN | 11863 | 301 |
| 12 | 03 BROOKLYN | 11615 | 303 |
| 5 | 01 STATEN ISLAND | 11438 | 501 |
| 31 | 07 QUEENS | 11210 | 407 |
| 21 | 05 BROOKLYN | 10862 | 305 |
| 16 | 04 BRONX | 10628 | 204 |
| 4 | 01 QUEENS | 10410 | 401 |
| 58 | 17 BROOKLYN | 10208 | 317 |
| 54 | 14 BROOKLYN | 10179 | 314 |
| 28 | 07 BRONX | 9841 | 207 |
| 59 | 18 BROOKLYN | 9717 | 318 |
| 39 | 09 QUEENS | 9599 | 409 |
| 53 | 13 QUEENS | 9459 | 413 |
| 48 | 12 BRONX | 9412 | 212 |
| 45 | 11 BROOKLYN | 9309 | 311 |
| 20 | 05 BRONX | 9094 | 205 |
| 13 | 03 MANHATTAN | 8905 | 103 |
| 35 | 08 QUEENS | 8661 | 408 |
| 17 | 04 BROOKLYN | 8639 | 304 |
| 42 | 10 MANHATTAN | 8592 | 110 |
| 15 | 03 STATEN ISLAND | 8524 | 503 |
| 56 | 15 BROOKLYN | 8508 | 315 |
| 43 | 10 QUEENS | 8333 | 410 |
| 49 | 12 BROOKLYN | 8214 | 312 |
| 30 | 07 MANHATTAN | 8141 | 107 |
| 36 | 09 BRONX | 8092 | 209 |
| 41 | 10 BROOKLYN | 7808 | 310 |
| 33 | 08 BROOKLYN | 7797 | 308 |
| 7 | 02 BROOKLYN | 7747 | 302 |
| 37 | 09 BROOKLYN | 7571 | 309 |
| 25 | 06 BROOKLYN | 7373 | 306 |
| 10 | 02 STATEN ISLAND | 7059 | 502 |
| 0 | 0 Unspecified | 6882 | Invalid BoroCD |
| 14 | 03 QUEENS | 6799 | 403 |
| 38 | 09 MANHATTAN | 6792 | 109 |
| 73 | Unspecified BROOKLYN | 6771 | 3Un |
| 18 | 04 MANHATTAN | 6765 | 104 |
| 22 | 05 MANHATTAN | 6599 | 105 |
| 34 | 08 MANHATTAN | 6579 | 108 |
| 8 | 02 MANHATTAN | 6514 | 102 |
| 44 | 11 BRONX | 6448 | 211 |
| 74 | Unspecified MANHATTAN | 6427 | 1Un |
| 29 | 07 BROOKLYN | 6364 | 307 |
| 9 | 02 QUEENS | 6142 | 402 |
| 19 | 04 QUEENS | 5824 | 404 |
| 32 | 08 BRONX | 5753 | 208 |
| 47 | 11 QUEENS | 5748 | 411 |
| 24 | 06 BRONX | 5746 | 206 |
| 40 | 10 BRONX | 5719 | 210 |
| 46 | 11 MANHATTAN | 5714 | 111 |
| 72 | Unspecified BRONX | 5349 | 2Un |
| 55 | 14 QUEENS | 5284 | 414 |
| 11 | 03 BRONX | 5262 | 203 |
| 26 | 06 MANHATTAN | 5158 | 106 |
| 57 | 16 BROOKLYN | 5100 | 316 |
| 1 | 01 BRONX | 4915 | 201 |
| 75 | Unspecified QUEENS | 4870 | 4Un |
| 27 | 06 QUEENS | 4607 | 406 |
| 52 | 13 BROOKLYN | 3840 | 313 |
| 3 | 01 MANHATTAN | 3623 | 101 |
| 6 | 02 BRONX | 3470 | 202 |
| 76 | Unspecified STATEN ISLAND | 541 | 5Un |
| 69 | 83 QUEENS | 193 | 483 |
| 65 | 64 MANHATTAN | 126 | 164 |
| 66 | 80 QUEENS | 102 | 480 |
| 68 | 82 QUEENS | 72 | 482 |
| 67 | 81 QUEENS | 54 | 481 |
| 63 | 55 BROOKLYN | 53 | 355 |
| 62 | 28 BRONX | 26 | 228 |
| 60 | 26 BRONX | 25 | 226 |
| 71 | 95 STATEN ISLAND | 21 | 595 |
| 70 | 84 QUEENS | 18 | 484 |
| 61 | 27 BRONX | 17 | 227 |
| 64 | 56 BROOKLYN | 13 | 356 |
Uh oh, there are some unexpected Unspecified values in here - how can we get around them?
Let’s only recode records that don’t start with “U”.
def recode_borocd_counts(row):
    if "MANHATTAN" in row["Community Board"] and row["Community Board"][0] != "U":
        return "1" + row["Community Board"][:2]
    elif "BRONX" in row["Community Board"] and row["Community Board"][0] != "U":
        return "2" + row["Community Board"][:2]
    elif "BROOKLYN" in row["Community Board"] and row["Community Board"][0] != "U":
        return "3" + row["Community Board"][:2]
    elif "QUEENS" in row["Community Board"] and row["Community Board"][0] != "U":
        return "4" + row["Community Board"][:2]
    elif "STATEN ISLAND" in row["Community Board"] and row["Community Board"][0] != "U":
        return "5" + row["Community Board"][:2]
    else:
        return "Invalid BoroCD"


cb_counts["boro_cd"] = cb_counts.apply(recode_borocd_counts, axis=1)
cb_counts
| Community Board | num_311_requests | boro_cd | |
|---|---|---|---|
| 50 | 12 MANHATTAN | 14110 | 112 |
| 23 | 05 QUEENS | 12487 | 405 |
| 51 | 12 QUEENS | 12228 | 412 |
| 2 | 01 BROOKLYN | 11863 | 301 |
| 12 | 03 BROOKLYN | 11615 | 303 |
| 5 | 01 STATEN ISLAND | 11438 | 501 |
| 31 | 07 QUEENS | 11210 | 407 |
| 21 | 05 BROOKLYN | 10862 | 305 |
| 16 | 04 BRONX | 10628 | 204 |
| 4 | 01 QUEENS | 10410 | 401 |
| 58 | 17 BROOKLYN | 10208 | 317 |
| 54 | 14 BROOKLYN | 10179 | 314 |
| 28 | 07 BRONX | 9841 | 207 |
| 59 | 18 BROOKLYN | 9717 | 318 |
| 39 | 09 QUEENS | 9599 | 409 |
| 53 | 13 QUEENS | 9459 | 413 |
| 48 | 12 BRONX | 9412 | 212 |
| 45 | 11 BROOKLYN | 9309 | 311 |
| 20 | 05 BRONX | 9094 | 205 |
| 13 | 03 MANHATTAN | 8905 | 103 |
| 35 | 08 QUEENS | 8661 | 408 |
| 17 | 04 BROOKLYN | 8639 | 304 |
| 42 | 10 MANHATTAN | 8592 | 110 |
| 15 | 03 STATEN ISLAND | 8524 | 503 |
| 56 | 15 BROOKLYN | 8508 | 315 |
| 43 | 10 QUEENS | 8333 | 410 |
| 49 | 12 BROOKLYN | 8214 | 312 |
| 30 | 07 MANHATTAN | 8141 | 107 |
| 36 | 09 BRONX | 8092 | 209 |
| 41 | 10 BROOKLYN | 7808 | 310 |
| 33 | 08 BROOKLYN | 7797 | 308 |
| 7 | 02 BROOKLYN | 7747 | 302 |
| 37 | 09 BROOKLYN | 7571 | 309 |
| 25 | 06 BROOKLYN | 7373 | 306 |
| 10 | 02 STATEN ISLAND | 7059 | 502 |
| 0 | 0 Unspecified | 6882 | Invalid BoroCD |
| 14 | 03 QUEENS | 6799 | 403 |
| 38 | 09 MANHATTAN | 6792 | 109 |
| 73 | Unspecified BROOKLYN | 6771 | Invalid BoroCD |
| 18 | 04 MANHATTAN | 6765 | 104 |
| 22 | 05 MANHATTAN | 6599 | 105 |
| 34 | 08 MANHATTAN | 6579 | 108 |
| 8 | 02 MANHATTAN | 6514 | 102 |
| 44 | 11 BRONX | 6448 | 211 |
| 74 | Unspecified MANHATTAN | 6427 | Invalid BoroCD |
| 29 | 07 BROOKLYN | 6364 | 307 |
| 9 | 02 QUEENS | 6142 | 402 |
| 19 | 04 QUEENS | 5824 | 404 |
| 32 | 08 BRONX | 5753 | 208 |
| 47 | 11 QUEENS | 5748 | 411 |
| 24 | 06 BRONX | 5746 | 206 |
| 40 | 10 BRONX | 5719 | 210 |
| 46 | 11 MANHATTAN | 5714 | 111 |
| 72 | Unspecified BRONX | 5349 | Invalid BoroCD |
| 55 | 14 QUEENS | 5284 | 414 |
| 11 | 03 BRONX | 5262 | 203 |
| 26 | 06 MANHATTAN | 5158 | 106 |
| 57 | 16 BROOKLYN | 5100 | 316 |
| 1 | 01 BRONX | 4915 | 201 |
| 75 | Unspecified QUEENS | 4870 | Invalid BoroCD |
| 27 | 06 QUEENS | 4607 | 406 |
| 52 | 13 BROOKLYN | 3840 | 313 |
| 3 | 01 MANHATTAN | 3623 | 101 |
| 6 | 02 BRONX | 3470 | 202 |
| 76 | Unspecified STATEN ISLAND | 541 | Invalid BoroCD |
| 69 | 83 QUEENS | 193 | 483 |
| 65 | 64 MANHATTAN | 126 | 164 |
| 66 | 80 QUEENS | 102 | 480 |
| 68 | 82 QUEENS | 72 | 482 |
| 67 | 81 QUEENS | 54 | 481 |
| 63 | 55 BROOKLYN | 53 | 355 |
| 62 | 28 BRONX | 26 | 228 |
| 60 | 26 BRONX | 25 | 226 |
| 71 | 95 STATEN ISLAND | 21 | 595 |
| 70 | 84 QUEENS | 18 | 484 |
| 61 | 27 BRONX | 17 | 227 |
| 64 | 56 BROOKLYN | 13 | 356 |
We can make this function easier to read by isolating the logic that applies to all the conditions. This is called “refactoring”.
def recode_borocd_counts(row):
    board = row["Community Board"]

    # doing a check and then returning from a function early is known as a "guard clause"
    if board.startswith("U"):
        return "Invalid BoroCD"

    num = board[0:2]

    if "MANHATTAN" in board:
        return "1" + num
    elif "BRONX" in board:
        return "2" + num
    elif "BROOKLYN" in board:
        return "3" + num
    elif "QUEENS" in board:
        return "4" + num
    elif "STATEN ISLAND" in board:
        return "5" + num
cb_counts["boro_cd"] = cb_counts.apply(recode_borocd_counts, axis=1)
cb_counts
| Community Board | num_311_requests | boro_cd | |
|---|---|---|---|
| 50 | 12 MANHATTAN | 14110 | 112 |
| 23 | 05 QUEENS | 12487 | 405 |
| 51 | 12 QUEENS | 12228 | 412 |
| 2 | 01 BROOKLYN | 11863 | 301 |
| 12 | 03 BROOKLYN | 11615 | 303 |
| 5 | 01 STATEN ISLAND | 11438 | 501 |
| 31 | 07 QUEENS | 11210 | 407 |
| 21 | 05 BROOKLYN | 10862 | 305 |
| 16 | 04 BRONX | 10628 | 204 |
| 4 | 01 QUEENS | 10410 | 401 |
| 58 | 17 BROOKLYN | 10208 | 317 |
| 54 | 14 BROOKLYN | 10179 | 314 |
| 28 | 07 BRONX | 9841 | 207 |
| 59 | 18 BROOKLYN | 9717 | 318 |
| 39 | 09 QUEENS | 9599 | 409 |
| 53 | 13 QUEENS | 9459 | 413 |
| 48 | 12 BRONX | 9412 | 212 |
| 45 | 11 BROOKLYN | 9309 | 311 |
| 20 | 05 BRONX | 9094 | 205 |
| 13 | 03 MANHATTAN | 8905 | 103 |
| 35 | 08 QUEENS | 8661 | 408 |
| 17 | 04 BROOKLYN | 8639 | 304 |
| 42 | 10 MANHATTAN | 8592 | 110 |
| 15 | 03 STATEN ISLAND | 8524 | 503 |
| 56 | 15 BROOKLYN | 8508 | 315 |
| 43 | 10 QUEENS | 8333 | 410 |
| 49 | 12 BROOKLYN | 8214 | 312 |
| 30 | 07 MANHATTAN | 8141 | 107 |
| 36 | 09 BRONX | 8092 | 209 |
| 41 | 10 BROOKLYN | 7808 | 310 |
| 33 | 08 BROOKLYN | 7797 | 308 |
| 7 | 02 BROOKLYN | 7747 | 302 |
| 37 | 09 BROOKLYN | 7571 | 309 |
| 25 | 06 BROOKLYN | 7373 | 306 |
| 10 | 02 STATEN ISLAND | 7059 | 502 |
| 0 | 0 Unspecified | 6882 | None |
| 14 | 03 QUEENS | 6799 | 403 |
| 38 | 09 MANHATTAN | 6792 | 109 |
| 73 | Unspecified BROOKLYN | 6771 | Invalid BoroCD |
| 18 | 04 MANHATTAN | 6765 | 104 |
| 22 | 05 MANHATTAN | 6599 | 105 |
| 34 | 08 MANHATTAN | 6579 | 108 |
| 8 | 02 MANHATTAN | 6514 | 102 |
| 44 | 11 BRONX | 6448 | 211 |
| 74 | Unspecified MANHATTAN | 6427 | Invalid BoroCD |
| 29 | 07 BROOKLYN | 6364 | 307 |
| 9 | 02 QUEENS | 6142 | 402 |
| 19 | 04 QUEENS | 5824 | 404 |
| 32 | 08 BRONX | 5753 | 208 |
| 47 | 11 QUEENS | 5748 | 411 |
| 24 | 06 BRONX | 5746 | 206 |
| 40 | 10 BRONX | 5719 | 210 |
| 46 | 11 MANHATTAN | 5714 | 111 |
| 72 | Unspecified BRONX | 5349 | Invalid BoroCD |
| 55 | 14 QUEENS | 5284 | 414 |
| 11 | 03 BRONX | 5262 | 203 |
| 26 | 06 MANHATTAN | 5158 | 106 |
| 57 | 16 BROOKLYN | 5100 | 316 |
| 1 | 01 BRONX | 4915 | 201 |
| 75 | Unspecified QUEENS | 4870 | Invalid BoroCD |
| 27 | 06 QUEENS | 4607 | 406 |
| 52 | 13 BROOKLYN | 3840 | 313 |
| 3 | 01 MANHATTAN | 3623 | 101 |
| 6 | 02 BRONX | 3470 | 202 |
| 76 | Unspecified STATEN ISLAND | 541 | Invalid BoroCD |
| 69 | 83 QUEENS | 193 | 483 |
| 65 | 64 MANHATTAN | 126 | 164 |
| 66 | 80 QUEENS | 102 | 480 |
| 68 | 82 QUEENS | 72 | 482 |
| 67 | 81 QUEENS | 54 | 481 |
| 63 | 55 BROOKLYN | 53 | 355 |
| 62 | 28 BRONX | 26 | 228 |
| 60 | 26 BRONX | 25 | 226 |
| 71 | 95 STATEN ISLAND | 21 | 595 |
| 70 | 84 QUEENS | 18 | 484 |
| 61 | 27 BRONX | 17 | 227 |
| 64 | 56 BROOKLYN | 13 | 356 |
# Create a function recode_borocd_pop that combines and recodes the Borough and CD Number values to create a BoroCD unique ID
def recode_borocd_pop(row):
    if row.Borough == "Manhattan":
        return str(100 + row["CD Number"])
    elif row.Borough == "Bronx":
        return str(200 + row["CD Number"])
    elif row.Borough == "Brooklyn":
        return str(300 + row["CD Number"])
    elif row.Borough == "Queens":
        return str(400 + row["CD Number"])
    elif row.Borough == "Staten Island":
        return str(500 + row["CD Number"])
    else:
        return "Invalid BoroCD"
This is different than recode_borocd_counts() because:
The Borough and CD Number are seprate columns in the population DataFrame, rather than combined in one like the 311 data
We are working with the CD Number as an integer rather than a string
population["borocd"] = population.apply(recode_borocd_pop, axis=1)
population.head()
| Borough | CD Number | CD Name | 1970 Population | 1980 Population | 1990 Population | 2000 Population | 2010 Population | borocd | |
|---|---|---|---|---|---|---|---|---|---|
| 0 | Bronx | 1 | Melrose, Mott Haven, Port Morris | 138557 | 78441 | 77214 | 82159 | 91497 | 201 |
| 1 | Bronx | 2 | Hunts Point, Longwood | 99493 | 34399 | 39443 | 46824 | 52246 | 202 |
| 2 | Bronx | 3 | Morrisania, Crotona Park East | 150636 | 53635 | 57162 | 68574 | 79762 | 203 |
| 3 | Bronx | 4 | Highbridge, Concourse Village | 144207 | 114312 | 119962 | 139563 | 146441 | 204 |
| 4 | Bronx | 5 | University Hts., Fordham, Mt. Hope | 121807 | 107995 | 118435 | 128313 | 128200 | 205 |
# Join the population data onto the counts data after creating shared borocd unique ID
merged_data = pd.merge(left=cb_counts, right=population, left_on="boro_cd", right_on="borocd")

#Calculate 311 requests per capita
#Divide request count by 2010 population to get requests per capita
merged_data["request_per_capita"] = merged_data["num_311_requests"] / merged_data["2010 Population"]

merged_data.head()
| Community Board | num_311_requests | boro_cd | Borough | CD Number | CD Name | 1970 Population | 1980 Population | 1990 Population | 2000 Population | 2010 Population | borocd | request_per_capita | |
|---|---|---|---|---|---|---|---|---|---|---|---|---|---|
| 0 | 12 MANHATTAN | 14110 | 112 | Manhattan | 12 | Washington Heights, Inwood | 180561 | 179941 | 198192 | 208414 | 190020 | 112 | 0.074255 |
| 1 | 05 QUEENS | 12487 | 405 | Queens | 5 | Ridgewood, Glendale, Maspeth | 161022 | 150142 | 149126 | 165911 | 169190 | 405 | 0.073805 |
| 2 | 12 QUEENS | 12228 | 412 | Queens | 12 | Jamaica, St. Albans, Hollis | 206639 | 189383 | 201293 | 223602 | 225919 | 412 | 0.054126 |
| 3 | 01 BROOKLYN | 11863 | 301 | Brooklyn | 1 | Williamsburg, Greenpoint | 179390 | 142942 | 155972 | 160338 | 173083 | 301 | 0.068539 |
| 4 | 03 BROOKLYN | 11615 | 303 | Brooklyn | 3 | Bedford Stuyvesant | 203380 | 133379 | 138696 | 143867 | 152985 | 303 | 0.075922 |
#Let’s create a simplified new dataframe that only include the columns we care about and in a better order.
columns = [
    "borocd",
    "Borough",
    "CD Name",
    "2010 Population",
    "num_311_requests",
    "request_per_capita",
]
cd_data = merged_data[columns]

cd_data.head()
| borocd | Borough | CD Name | 2010 Population | num_311_requests | request_per_capita | |
|---|---|---|---|---|---|---|
| 0 | 112 | Manhattan | Washington Heights, Inwood | 190020 | 14110 | 0.074255 |
| 1 | 405 | Queens | Ridgewood, Glendale, Maspeth | 169190 | 12487 | 0.073805 |
| 2 | 412 | Queens | Jamaica, St. Albans, Hollis | 225919 | 12228 | 0.054126 |
| 3 | 301 | Brooklyn | Williamsburg, Greenpoint | 173083 | 11863 | 0.068539 |
| 4 | 303 | Brooklyn | Bedford Stuyvesant | 152985 | 11615 | 0.075922 |
Let’s check out which Community Districts have the highest complaints per capita
cd_data.sort_values("request_per_capita", ascending=False).head(10)
| borocd | Borough | CD Name | 2010 Population | num_311_requests | request_per_capita | |
|---|---|---|---|---|---|---|
| 38 | 105 | Manhattan | Midtown Business District | 51673 | 6599 | 0.127707 |
| 30 | 308 | Brooklyn | Crown Heights North | 96317 | 7797 | 0.080951 |
| 31 | 302 | Brooklyn | Brooklyn Heights, Fort Greene | 99617 | 7747 | 0.077768 |
| 32 | 309 | Brooklyn | Crown Heights South, Wingate | 98429 | 7571 | 0.076918 |
| 21 | 304 | Brooklyn | Bushwick | 112634 | 8639 | 0.076700 |
| 4 | 303 | Brooklyn | Bedford Stuyvesant | 152985 | 11615 | 0.075922 |
| 0 | 112 | Manhattan | Washington Heights, Inwood | 190020 | 14110 | 0.074255 |
| 22 | 110 | Manhattan | Central Harlem | 115723 | 8592 | 0.074246 |
| 1 | 405 | Queens | Ridgewood, Glendale, Maspeth | 169190 | 12487 | 0.073805 |
| 8 | 204 | Bronx | Highbridge, Concourse Village | 146441 | 10628 | 0.072575 |
While Inwood (112) had the highest number of complaints, it ranks further down on the list for requests per capita. Midtown may also be an outlier, based on it’s low residential population.
We tested recode_borocd_counts() above by calling it with an abitrary row and seeing if the result was what we expect. We can do the same with code! We’ll use the helper package ipytest.
import ipytest

ipytest.autoconfig()
%%ipytest --tb=short --verbosity=1


def test_equal():
    assert 2 == 2

def test_unequal():
    assert 1 == 2

def test_var():
    a = 2
    assert a == 1

def test_boroughs():
    boroughs = requests['Borough'].unique()
    assert len(boroughs) == 5
======================================= test session starts =======================================
platform win32 -- Python 3.11.0, pytest-7.4.0, pluggy-1.2.0 -- C:\Users\alfre\AppData\Local\Programs\Python\Python311\python.exe
cachedir: .pytest_cache
rootdir: C:\Users\alfre\Enceladus\jupyter\myprojects\Python Coding for Public Policy @ NYU Wagner
plugins: anyio-3.6.2, dash-2.10.0
collecting ... collected 4 items

t_3cfde7e6b8094e71b5400418fc3e9a86.py::test_equal PASSED                                     [ 25%]
t_3cfde7e6b8094e71b5400418fc3e9a86.py::test_unequal FAILED                                   [ 50%]
t_3cfde7e6b8094e71b5400418fc3e9a86.py::test_var FAILED                                       [ 75%]
t_3cfde7e6b8094e71b5400418fc3e9a86.py::test_boroughs FAILED                                  [100%]

============================================ FAILURES =============================================
__________________________________________ test_unequal ___________________________________________
C:\Users\alfre\AppData\Local\Temp\ipykernel_23004\2219926158.py:5: in test_unequal
    assert 1 == 2
E   assert 1 == 2
____________________________________________ test_var _____________________________________________
C:\Users\alfre\AppData\Local\Temp\ipykernel_23004\2219926158.py:9: in test_var
    assert a == 1
E   assert 2 == 1
__________________________________________ test_boroughs __________________________________________
C:\Users\alfre\AppData\Local\Temp\ipykernel_23004\2219926158.py:13: in test_boroughs
    assert len(boroughs) == 5
E   AssertionError: assert 6 == 5
E    +  where 6 = len(array(['BROOKLYN', 'QUEENS', 'BRONX', 'MANHATTAN', 'STATEN ISLAND',\n       'Unspecified'], dtype=object))
===================================== short test summary info =====================================
FAILED t_3cfde7e6b8094e71b5400418fc3e9a86.py::test_unequal - assert 1 == 2
FAILED t_3cfde7e6b8094e71b5400418fc3e9a86.py::test_var - assert 2 == 1
FAILED t_3cfde7e6b8094e71b5400418fc3e9a86.py::test_boroughs - AssertionError: assert 6 == 5
=================================== 3 failed, 1 passed in 0.44s ===================================
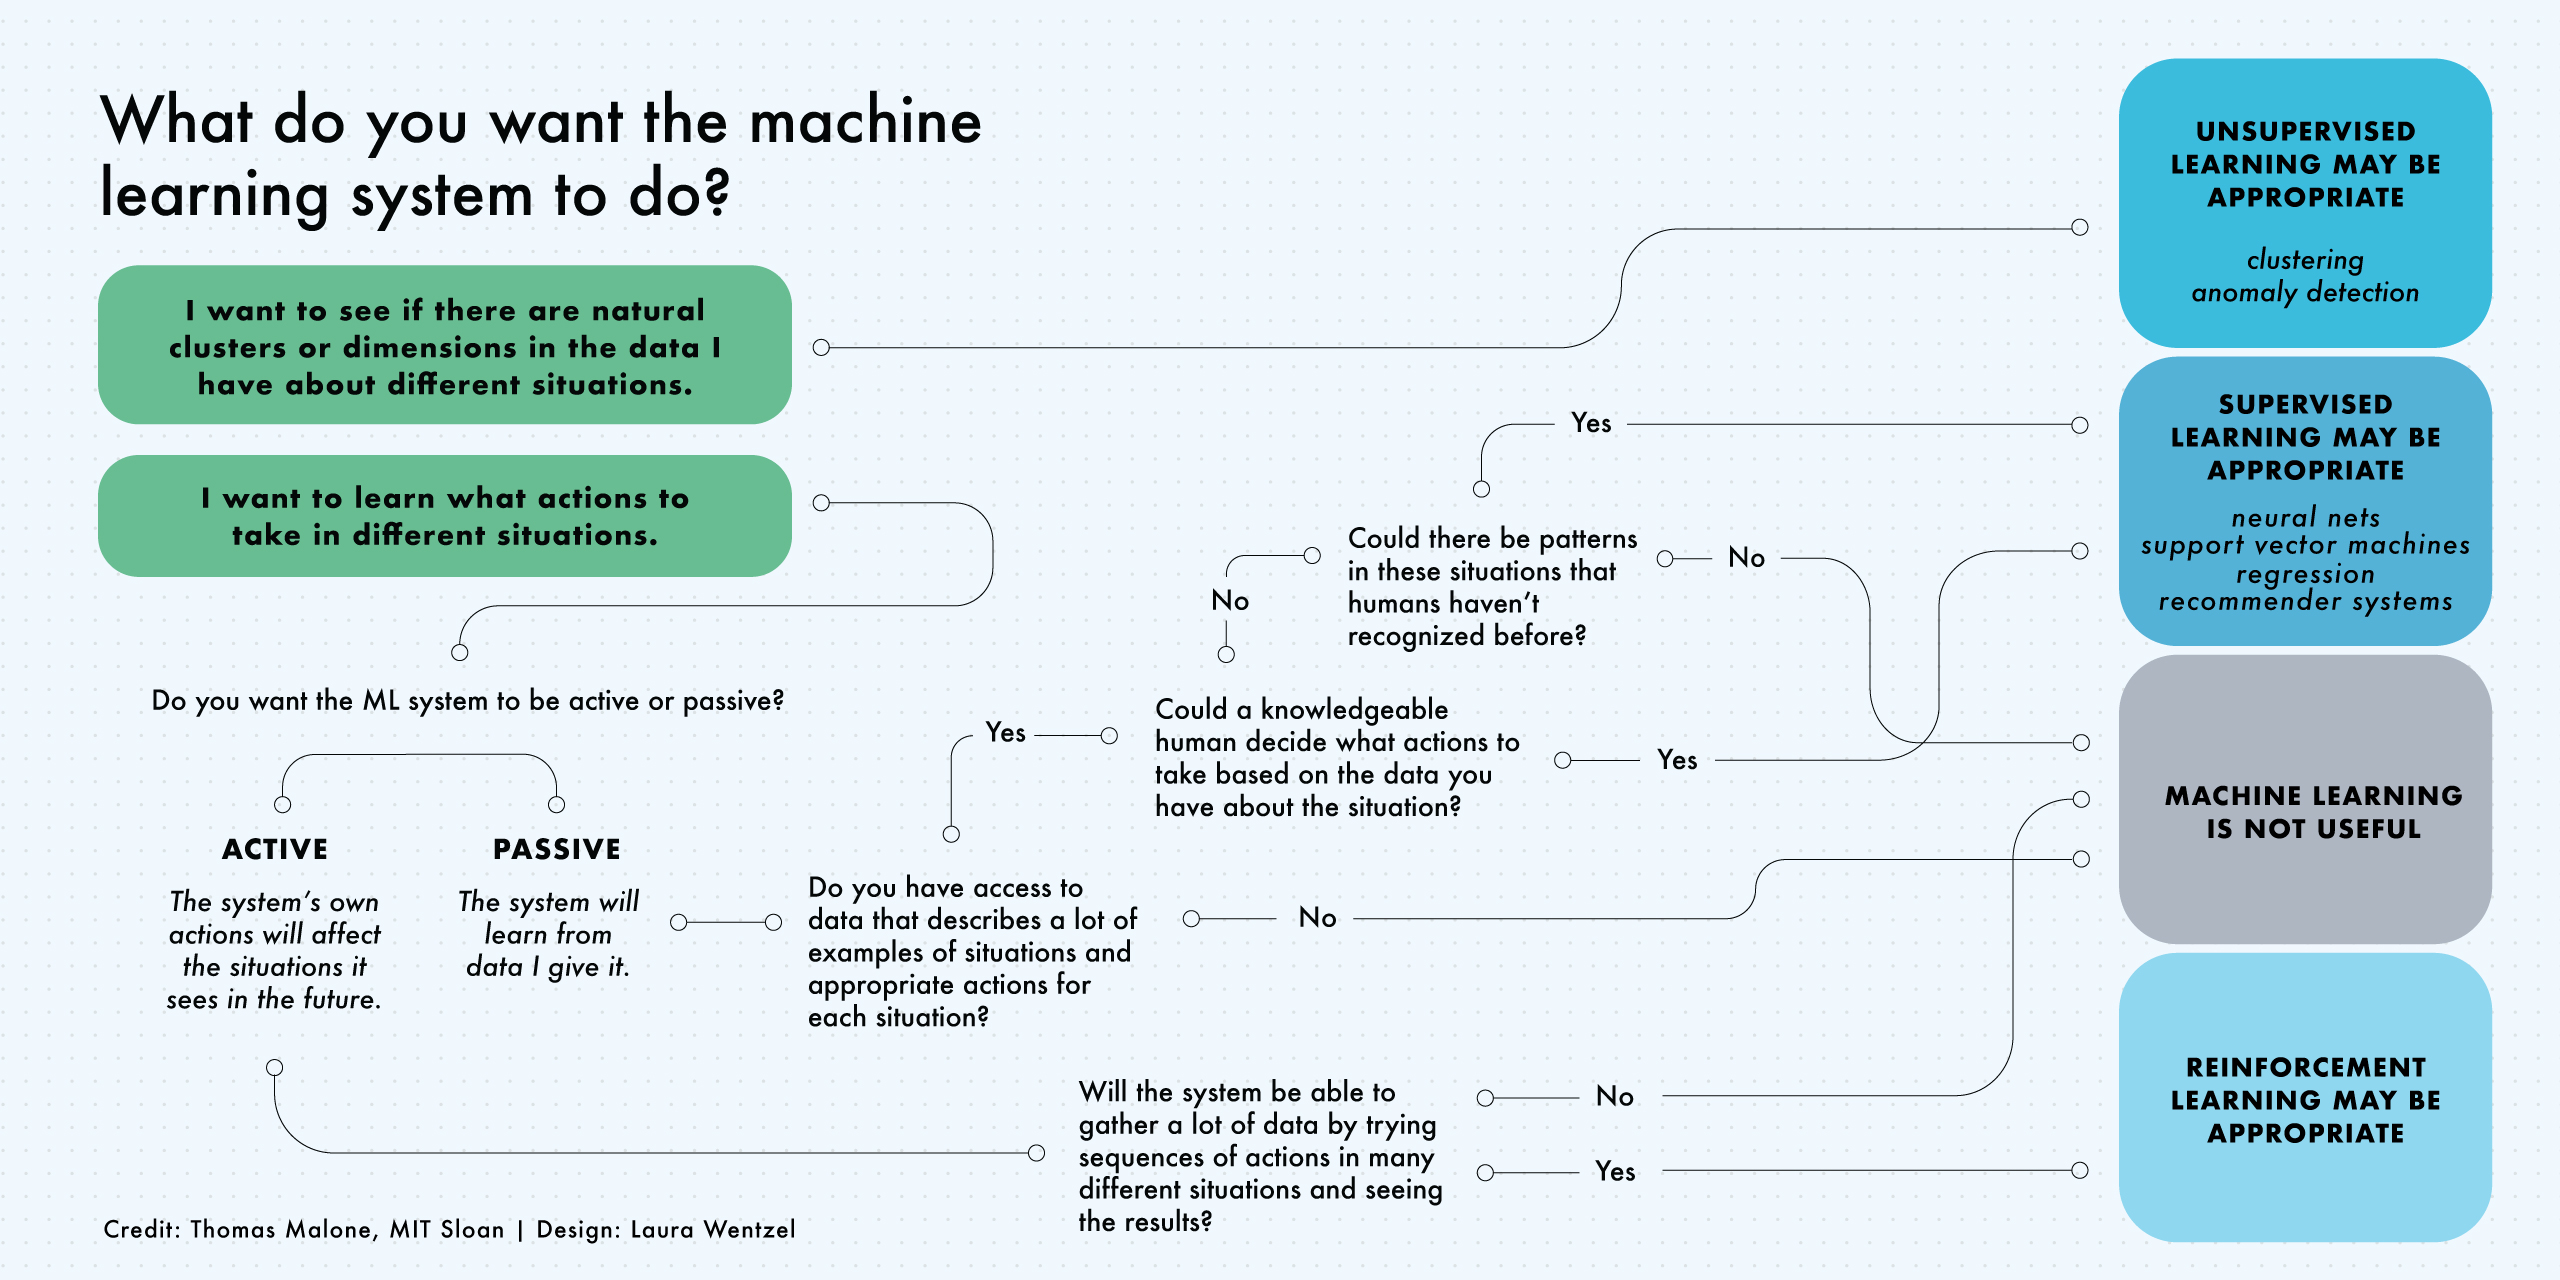
What do you want to do? |
Chart type |
|---|---|
Show changes over time |
Line chart |
Compare values for categorical data |
Bar chart |
Compare two numeric variables |
Scatter plot |
Count things / show distribution across a range |
Histogram |
Show geographic trends |
The Data Design Standards goes into more detail.
Pandas supports reshaping DataFrames through pivoting, like spreadsheets do.
testData = {'City': ['New York', 'New York', 'New York', 'LA', 'LA', 'LA', 'Chicago', 'Chicago', 'Chicago'],
            'Year': [2017, 2018, 2019, 2017,2018,2019,2017,2018,2019],
            'Population': [8437478,8390081,8336817,3975788,3977596, 3979576, 2711069, 2701423,269976] }
df = pd.DataFrame.from_dict(testData)
df.pivot(index='City', columns='Year', values='Population')
| Year | 2017 | 2018 | 2019 |
|---|---|---|---|
| City | |||
| Chicago | 2711069 | 2701423 | 269976 |
| LA | 3975788 | 3977596 | 3979576 |
| New York | 8437478 | 8390081 | 8336817 |
In real/ideal world, start with specific question and find data to answer it:
Data needed often doesn’t exist or is hard (or impossible) to find/access
From Wikipedia:
A time series is a series of data points indexed (or listed or graphed) in time order. Most commonly, a time series is a sequence taken at successive equally spaced points in time. Thus it is a sequence of discrete-time data.
import seaborn as sns
import matplotlib.pyplot as plt
requests = pd.read_csv("https://storage.googleapis.com/python-public-policy/data/311_requests_2018-19_sample_clean.csv.zip")
requests[["Created Date", "Closed Date"]].head()
C:\Users\alfre\AppData\Local\Temp\ipykernel_23004\94077557.py:1: DtypeWarning: Columns (8,20,31,34) have mixed types. Specify dtype option on import or set low_memory=False.
  requests = pd.read_csv("https://storage.googleapis.com/python-public-policy/data/311_requests_2018-19_sample_clean.csv.zip")
| Created Date | Closed Date | |
|---|---|---|
| 0 | 08/01/2018 12:05:13 AM | 08/01/2018 12:05:13 AM |
| 1 | 08/01/2018 12:06:05 AM | 08/01/2018 12:06:05 AM |
| 2 | 08/01/2018 12:06:16 AM | 08/03/2018 02:03:55 PM |
| 3 | 08/01/2018 12:06:29 AM | 08/01/2018 02:54:24 AM |
| 4 | 08/01/2018 12:06:51 AM | 08/01/2018 04:54:26 AM |
# Convert columns to timestamps from strings
requests["Created Date"] = pd.to_datetime(requests["Created Date"], format="%m/%d/%Y %I:%M:%S %p")
requests["Closed Date"] = pd.to_datetime(requests["Closed Date"], format="%m/%d/%Y %I:%M:%S %p")
requests[["Created Date", "Closed Date"]]
| Created Date | Closed Date | |
|---|---|---|
| 0 | 2018-08-01 00:05:13 | 2018-08-01 00:05:13 |
| 1 | 2018-08-01 00:06:05 | 2018-08-01 00:06:05 |
| 2 | 2018-08-01 00:06:16 | 2018-08-03 14:03:55 |
| 3 | 2018-08-01 00:06:29 | 2018-08-01 02:54:24 |
| 4 | 2018-08-01 00:06:51 | 2018-08-01 04:54:26 |
| ... | ... | ... |
| 499953 | 2019-08-24 01:46:09 | NaT |
| 499954 | 2019-08-24 01:49:49 | NaT |
| 499955 | 2019-08-24 01:56:35 | NaT |
| 499956 | 2019-08-24 01:56:40 | NaT |
| 499957 | 2019-08-24 01:57:58 | NaT |
499958 rows × 2 columns
noise = requests[requests["Complaint Type"] == "Noise - Residential"]
noise_per_day = noise.resample("D", on="Created Date").size().reset_index(name="count_requests")

noise_per_day.head()
| Created Date | count_requests | |
|---|---|---|
| 0 | 2018-08-01 | 50 |
| 1 | 2018-08-02 | 49 |
| 2 | 2018-08-03 | 65 |
| 3 | 2018-08-04 | 162 |
| 4 | 2018-08-05 | 191 |
sns.lineplot(
    data=noise_per_day,
    x="Created Date",
    y="count_requests",
).set(title="Noise complaints per day")
plt.show()

noise_per_day_rolling = noise_per_day.rolling("7D", on="Created Date").mean()

sns.lineplot(
    data=noise_per_day_rolling,
    x="Created Date",
    y="count_requests",
).set(title="7-day rolling average of noise complaints per day")
plt.show()

# resample() is a time-based groupby
noise_per_week = noise.resample("W", on="Created Date").size().reset_index(name="count_requests")

sns.lineplot(
    data=noise_per_week,
    x="Created Date",
    y="count_requests",
).set(title="Noise complaints per week")
plt.show()

noise.resample("W", on="Created Date").size()
Created Date
2018-08-05     517
2018-08-12     569
2018-08-19     677
2018-08-26     856
2018-09-02     783
2018-09-09     770
2018-09-16     785
2018-09-23     793
2018-09-30     842
2018-10-07     725
2018-10-14     687
2018-10-21     715
2018-10-28     714
2018-11-04     722
2018-11-11     651
2018-11-18     619
2018-11-25     713
2018-12-02     644
2018-12-09     671
2018-12-16     645
2018-12-23     543
2018-12-30     748
2019-01-06     784
2019-01-13     615
2019-01-20     591
2019-01-27     658
2019-02-03     673
2019-02-10     597
2019-02-17     645
2019-02-24     700
2019-03-03     624
2019-03-10     638
2019-03-17     721
2019-03-24     666
2019-03-31     743
2019-04-07     819
2019-04-14     815
2019-04-21     748
2019-04-28     801
2019-05-05     867
2019-05-12     876
2019-05-19     962
2019-05-26    1048
2019-06-02    1197
2019-06-09     989
2019-06-16    1074
2019-06-23    1009
2019-06-30     726
2019-07-07     903
2019-07-14     719
2019-07-21     565
2019-07-28     674
2019-08-04     609
2019-08-11     741
2019-08-18     752
2019-08-25     373
Freq: W-SUN, dtype: int64
# can be rewrritten as

noise.groupby([pd.Grouper(key="Created Date", freq="W")]).size()
Created Date
2018-08-05     517
2018-08-12     569
2018-08-19     677
2018-08-26     856
2018-09-02     783
2018-09-09     770
2018-09-16     785
2018-09-23     793
2018-09-30     842
2018-10-07     725
2018-10-14     687
2018-10-21     715
2018-10-28     714
2018-11-04     722
2018-11-11     651
2018-11-18     619
2018-11-25     713
2018-12-02     644
2018-12-09     671
2018-12-16     645
2018-12-23     543
2018-12-30     748
2019-01-06     784
2019-01-13     615
2019-01-20     591
2019-01-27     658
2019-02-03     673
2019-02-10     597
2019-02-17     645
2019-02-24     700
2019-03-03     624
2019-03-10     638
2019-03-17     721
2019-03-24     666
2019-03-31     743
2019-04-07     819
2019-04-14     815
2019-04-21     748
2019-04-28     801
2019-05-05     867
2019-05-12     876
2019-05-19     962
2019-05-26    1048
2019-06-02    1197
2019-06-09     989
2019-06-16    1074
2019-06-23    1009
2019-06-30     726
2019-07-07     903
2019-07-14     719
2019-07-21     565
2019-07-28     674
2019-08-04     609
2019-08-11     741
2019-08-18     752
2019-08-25     373
Freq: W-SUN, dtype: int64
# This means you can add other columns to group by
noise.groupby([pd.Grouper(key="Created Date", freq="W"), "Borough"]).size()
Created Date  Borough
2018-08-05    BRONX            134
              BROOKLYN         157
              MANHATTAN         90
              QUEENS           112
              STATEN ISLAND     23
                              ...
2019-08-25    BROOKLYN         126
              MANHATTAN         69
              QUEENS            75
              STATEN ISLAND     16
              Unspecified        2
Length: 310, dtype: int64
noise_per_day["weekday_name"] = noise_per_day["Created Date"].dt.day_name()
noise_per_day["weekday"] = noise_per_day["Created Date"].dt.weekday

noise_per_day[["Created Date", "weekday_name", "weekday"]]
| Created Date | weekday_name | weekday | |
|---|---|---|---|
| 0 | 2018-08-01 | Wednesday | 2 |
| 1 | 2018-08-02 | Thursday | 3 |
| 2 | 2018-08-03 | Friday | 4 |
| 3 | 2018-08-04 | Saturday | 5 |
| 4 | 2018-08-05 | Sunday | 6 |
| ... | ... | ... | ... |
| 384 | 2019-08-20 | Tuesday | 1 |
| 385 | 2019-08-21 | Wednesday | 2 |
| 386 | 2019-08-22 | Thursday | 3 |
| 387 | 2019-08-23 | Friday | 4 |
| 388 | 2019-08-24 | Saturday | 5 |
389 rows × 3 columns
Tip
Median count of 311 requests per weekday
# having the (numeric) `weekday` first ensures they're in order
columns = ["weekday", "weekday_name"]
noise_weekday = (
    noise_per_day.groupby(columns)["count_requests"].median().reset_index(name="median_requests")
)

noise_weekday
| weekday | weekday_name | median_requests | |
|---|---|---|---|
| 0 | 0 | Monday | 76.0 |
| 1 | 1 | Tuesday | 65.0 |
| 2 | 2 | Wednesday | 62.0 |
| 3 | 3 | Thursday | 66.0 |
| 4 | 4 | Friday | 93.0 |
| 5 | 5 | Saturday | 160.5 |
| 6 | 6 | Sunday | 170.0 |
sns.barplot(
    data=noise_weekday,
    x="weekday_name",
    y="median_requests",
    color = "blue"
).set(title="Noise complaints per day of week")
plt.show()

noise_per_date_hour = (
    noise.resample("H", on="Created Date").size().reset_index(name="count_requests")
)

# create a column for the hour number, so we can group on it
noise_per_date_hour["hour"] = noise_per_date_hour["Created Date"].dt.hour

noise_per_date_hour
| Created Date | count_requests | hour | |
|---|---|---|---|
| 0 | 2018-08-01 00:00:00 | 6 | 0 |
| 1 | 2018-08-01 01:00:00 | 3 | 1 |
| 2 | 2018-08-01 02:00:00 | 4 | 2 |
| 3 | 2018-08-01 03:00:00 | 1 | 3 |
| 4 | 2018-08-01 04:00:00 | 0 | 4 |
| ... | ... | ... | ... |
| 9309 | 2019-08-23 21:00:00 | 10 | 21 |
| 9310 | 2019-08-23 22:00:00 | 24 | 22 |
| 9311 | 2019-08-23 23:00:00 | 20 | 23 |
| 9312 | 2019-08-24 00:00:00 | 18 | 0 |
| 9313 | 2019-08-24 01:00:00 | 15 | 1 |
9314 rows × 3 columns
median count of complaints per hour
noise_hour = (
    noise_per_date_hour.groupby("hour")["count_requests"]
    .median()
    .reset_index(name="median_requests")
)
noise_hour
| hour | median_requests | |
|---|---|---|
| 0 | 0 | 7.0 |
| 1 | 1 | 5.0 |
| 2 | 2 | 3.0 |
| 3 | 3 | 2.0 |
| 4 | 4 | 1.0 |
| 5 | 5 | 1.0 |
| 6 | 6 | 1.0 |
| 7 | 7 | 1.0 |
| 8 | 8 | 1.0 |
| 9 | 9 | 1.0 |
| 10 | 10 | 1.5 |
| 11 | 11 | 1.0 |
| 12 | 12 | 2.0 |
| 13 | 13 | 2.0 |
| 14 | 14 | 2.0 |
| 15 | 15 | 2.0 |
| 16 | 16 | 2.0 |
| 17 | 17 | 3.0 |
| 18 | 18 | 4.0 |
| 19 | 19 | 5.0 |
| 20 | 20 | 6.0 |
| 21 | 21 | 7.0 |
| 22 | 22 | 11.0 |
| 23 | 23 | 10.0 |
sns.lineplot(
    data=noise_hour,
    x="hour",
    y="median_requests",
).set(title="Noise complaints per hour")
plt.show()

# calculate the amount of time that passed between Created Date and Closed Date

requests["resolution_duration"] = requests["Closed Date"] - requests["Created Date"]

# print head to check results

requests[["Closed Date", "Created Date", "resolution_duration"]].head()
| Closed Date | Created Date | resolution_duration | |
|---|---|---|---|
| 0 | 2018-08-01 00:05:13 | 2018-08-01 00:05:13 | 0 days 00:00:00 |
| 1 | 2018-08-01 00:06:05 | 2018-08-01 00:06:05 | 0 days 00:00:00 |
| 2 | 2018-08-03 14:03:55 | 2018-08-01 00:06:16 | 2 days 13:57:39 |
| 3 | 2018-08-01 02:54:24 | 2018-08-01 00:06:29 | 0 days 02:47:55 |
| 4 | 2018-08-01 04:54:26 | 2018-08-01 00:06:51 | 0 days 04:47:35 |
requests.resolution_duration.median()
Timedelta('1 days 05:19:58')
# Ignore empty values
df_clean = requests.dropna(subset=["resolution_duration"])
median_durations = df_clean.groupby("Complaint Type").resolution_duration.median()

median_durations.nlargest(15).reset_index(name="median_duration")
| Complaint Type | median_duration | |
|---|---|---|
| 0 | For Hire Vehicle Complaint | 98 days 15:08:41 |
| 1 | Taxi Complaint | 98 days 09:37:53 |
| 2 | Graffiti | 89 days 11:29:38 |
| 3 | New Tree Request | 83 days 16:56:30 |
| 4 | Food Establishment | 60 days 15:45:06 |
| 5 | Facades | 55 days 21:04:26 |
| 6 | Sustainability Enforcement | 47 days 12:47:23 |
| 7 | Radioactive Material | 46 days 01:01:18 |
| 8 | Drinking Water | 35 days 00:24:20 |
| 9 | Bike Rack Condition | 33 days 22:22:32 |
| 10 | Highway Sign - Missing | 32 days 01:38:15.500000 |
| 11 | School Maintenance | 28 days 20:56:12.500000 |
| 12 | Vacant Lot | 27 days 23:44:30 |
| 13 | Transportation Provider Complaint | 24 days 20:15:41 |
| 14 | Plumbing | 20 days 11:44:44 |
median_durations.nsmallest(15).reset_index(name="median_duration")
| Complaint Type | median_duration | |
|---|---|---|
| 0 | BEST/Site Safety | 0 days 00:00:00 |
| 1 | Construction Safety Enforcement | 0 days 00:00:00 |
| 2 | Derelict Vehicles | 0 days 00:00:00 |
| 3 | Miscellaneous Categories | 0 days 00:00:00 |
| 4 | Quality of Life | 0 days 00:00:00 |
| 5 | Street Light Condition | 0 days 00:00:00 |
| 6 | Taxi Report | 0 days 00:00:34 |
| 7 | Benefit Card Replacement | 0 days 00:00:39 |
| 8 | For Hire Vehicle Report | 0 days 00:00:42 |
| 9 | Advocate-Personal Exemptions | 0 days 00:05:39 |
| 10 | Advocate-Co-opCondo Abatement | 0 days 00:07:23 |
| 11 | Advocate-Prop Refunds/Credits | 0 days 00:07:41 |
| 12 | Advocate - Other | 0 days 00:08:37.500000 |
| 13 | Taxpayer Advocate Inquiry | 0 days 00:08:51 |
| 14 | DPR Internal | 0 days 00:25:41 |
# Noise complaints over New Year’s
after_dec_31 = requests["Created Date"] >= "2018-12-31"
before_jan_2 = requests["Created Date"] < "2019-01-02"
residential_only = requests["Complaint Type"] == "Noise - Residential"

display_columns = ["Created Date", "Complaint Type"]
requests[after_dec_31 & before_jan_2 & residential_only][display_columns]
| Created Date | Complaint Type | |
|---|---|---|
| 201471 | 2018-12-31 00:03:37 | Noise - Residential |
| 201473 | 2018-12-31 00:05:12 | Noise - Residential |
| 201475 | 2018-12-31 00:07:00 | Noise - Residential |
| 201478 | 2018-12-31 00:11:18 | Noise - Residential |
| 201481 | 2018-12-31 00:19:44 | Noise - Residential |
| ... | ... | ... |
| 203413 | 2019-01-01 22:59:22 | Noise - Residential |
| 203415 | 2019-01-01 23:03:03 | Noise - Residential |
| 203416 | 2019-01-01 23:04:27 | Noise - Residential |
| 203420 | 2019-01-01 23:10:46 | Noise - Residential |
| 203435 | 2019-01-01 23:56:22 | Noise - Residential |
321 rows × 2 columns
import plotly

medals = plotly.data.medals_wide()
medals
| nation | gold | silver | bronze | |
|---|---|---|---|---|
| 0 | South Korea | 24 | 13 | 11 |
| 1 | China | 10 | 15 | 8 |
| 2 | Canada | 9 | 12 | 12 |
medals["gold"] >= 10
0     True
1     True
2    False
Name: gold, dtype: bool
medals["silver"] >= 14
0    False
1     True
2    False
Name: silver, dtype: bool
(medals["gold"] >= 10) & (medals["silver"] >= 14)
0    False
1     True
2    False
dtype: bool
medals[(medals["gold"] >= 10) & (medals["silver"] >= 14)]
| nation | gold | silver | bronze | |
|---|---|---|---|---|
| 1 | China | 10 | 15 | 8 |
Refactored:
high_gold = medals["gold"] >= 10
high_silver = medals["silver"] >= 14

medals[high_gold & high_silver]
| nation | gold | silver | bronze | |
|---|---|---|---|---|
| 1 | China | 10 | 15 | 8 |
Method |
How it happens |
Pros |
Cons |
|---|---|---|---|
Bulk |
Download, someone hands you a flash drive, etc. |
Fast, one-time transfer |
Can be large |
Scraping |
Data only available through a web site, PDF, or doc |
You can turn anything into data |
Tedious; fragile |
APIs |
If organization makes one available |
Usually allows some filtering; can always pull latest-and-greatest |
Requires network connection for every call; higher barrier to entry (reading documentation); subject to availability and performance of API |
InspectNetwork tab and reload.Filter to XHR.
Click the API call.
We only see this because the tables on fec.gov are rendered client-side using their JSON API. That won’t be the case for all tables on all sites.

For APIs:
Often split into “base URL” + “endpoint”
Endpoints are like function names: they represent the information you are retrieving or thing you are trying to do
Parameters are like function arguments:
They allow options to be specified
Some are required, some are optional
They will differ from one endpoint/function to another
Anchors won’t be used
Reload the page.
In the Network tab’s request list, right-click the API call.
Click Open in New Tab.
Replace the api_key value with DEMO_KEY.
import requests

params = {
    "api_key": "DEMO_KEY",
#     "q": "Jimmy McMillan",
#     "sort": "-first_file_date",
    "has_raised_funds": "true",
}
response = requests.get("https://api.open.fec.gov/v1/candidates/", params=params)
data = response.json()

pd.DataFrame(data["results"])
| active_through | candidate_id | candidate_inactive | candidate_status | cycles | district | district_number | election_districts | election_years | federal_funds_flag | first_file_date | has_raised_funds | inactive_election_years | incumbent_challenge | incumbent_challenge_full | last_f2_date | last_file_date | load_date | name | office | office_full | party | party_full | state | |
|---|---|---|---|---|---|---|---|---|---|---|---|---|---|---|---|---|---|---|---|---|---|---|---|---|
| 0 | 2022 | H2CO07170 | False | P | [2022, 2024] | 07 | 7 | [07] | [2022] | False | 2021-12-27 | True | None | O | Open seat | 2022-08-10 | 2022-08-10 | 2023-03-09T10:16:03 | AADLAND, ERIK | H | House | REP | REPUBLICAN PARTY | CO |
| 1 | 2022 | H2UT03280 | False | C | [2022] | 03 | 3 | [03] | [2022] | False | 2020-03-24 | True | None | C | Challenger | 2022-03-21 | 2022-03-21 | 2022-04-13T21:10:09 | AALDERS, TIM | H | House | REP | REPUBLICAN PARTY | UT |
| 2 | 2018 | S2UT00229 | False | P | [2012, 2014, 2016, 2018, 2020] | 00 | 0 | [00, 00] | [2012, 2018] | False | 2012-02-08 | True | None | O | Open seat | 2018-04-23 | 2018-04-23 | 2019-03-27T16:02:41 | AALDERS, TIMOTHY NOEL | S | Senate | CON | CONSTITUTION PARTY | UT |
| 3 | 2020 | H0TX22260 | False | C | [2020] | 22 | 22 | [22] | [2020] | False | 2019-10-17 | True | None | O | Open seat | 2019-10-17 | 2019-10-17 | 2020-03-18T21:13:37 | AALOORI, BANGAR REDDY | H | House | REP | REPUBLICAN PARTY | TX |
| 4 | 1978 | H6PA16106 | False | P | [1976, 1978, 1980] | 16 | 16 | [16, 16] | [1976, 1978] | False | 1976-04-12 | True | None | None | None | 1978-07-05 | 1978-07-05 | 2002-03-30T00:00:00 | AAMODT, NORMAN O. | H | House | REP | REPUBLICAN PARTY | PA |
| 5 | 2012 | H2CA01110 | False | P | [2012, 2014, 2016] | 01 | 1 | [01] | [2012] | False | 2012-02-22 | True | None | C | Challenger | 2012-02-22 | 2012-02-22 | 2013-04-26T09:04:30 | AANESTAD, SAMUEL | H | House | REP | REPUBLICAN PARTY | CA |
| 6 | 2018 | H8CO06237 | False | C | [2018] | 06 | 6 | [06] | [2018] | False | 2017-04-26 | True | None | C | Challenger | 2017-04-26 | 2017-04-26 | 2017-08-01T20:57:28 | AARESTAD, DAVID | H | House | DEM | DEMOCRATIC PARTY | CO |
| 7 | 2008 | P80002926 | False | N | [2006, 2008, 2010, 2012, 2014, 2016] | 00 | 0 | [00] | [2008] | False | 2005-10-12 | True | None | O | Open seat | 2007-03-13 | 2007-03-13 | 2016-11-17T06:10:48 | AARON, LAURA DAVIS | P | President | DEM | DEMOCRATIC PARTY | US |
| 8 | 2024 | H2CA30291 | False | N | [2022, 2024] | 32 | 32 | [32, 32] | [2022, 2024] | False | 2021-01-16 | True | None | C | Challenger | 2022-07-15 | 2022-07-15 | 2023-01-12T22:24:01 | AAZAMI, SHERVIN | H | House | DEM | DEMOCRATIC PARTY | CA |
| 9 | 2022 | H2MN07162 | False | P | [2022, 2024] | 07 | 7 | [07] | [2022] | False | 2022-06-06 | True | None | C | Challenger | 2022-06-06 | 2022-06-06 | 2023-03-09T10:16:03 | ABAHSAIN, JILL | H | House | DFL | DEMOCRATIC-FARMER-LABOR | MN |
| 10 | 2000 | H0MA01024 | False | P | [2000, 2002, 2004] | 01 | 1 | [01] | [2000] | False | 2000-02-02 | True | None | C | Challenger | 2000-02-02 | 2000-02-02 | 2002-04-12T00:00:00 | ABAIR, PETER JON | H | House | REP | REPUBLICAN PARTY | MA |
| 11 | 2008 | H6NJ05155 | False | C | [2006, 2008] | 05 | 5 | [05, 05] | [2006, 2008] | False | 2006-03-28 | True | None | C | Challenger | 2007-06-05 | 2007-06-05 | 2009-04-29T00:00:00 | ABATE, CAMILLE M | H | House | DEM | DEMOCRATIC PARTY | NJ |
| 12 | 1992 | H2NJ12036 | False | P | [1992, 1994, 1996, 1998] | 12 | 12 | [12] | [1992] | False | 1992-04-15 | True | None | C | Challenger | 1992-04-15 | 1992-04-15 | 2002-04-03T00:00:00 | ABATE, FRANK G | H | House | DEM | DEMOCRATIC PARTY | NJ |
| 13 | 1990 | H0IA03071 | False | C | [1990] | 03 | 3 | [03] | [1990] | False | 1990-05-01 | True | None | C | Challenger | 1990-05-01 | 1990-05-01 | 2002-03-30T00:00:00 | ABBAS, JEFFREY LYN | H | House | REP | REPUBLICAN PARTY | IA |
| 14 | 1994 | H4TX15043 | False | C | [1994] | 15 | 15 | [15] | [1994] | False | 1994-01-14 | True | None | C | Challenger | 1994-01-14 | 1994-01-14 | 2002-03-30T00:00:00 | ABBOTT, BONNIE | H | House | REP | REPUBLICAN PARTY | TX |
| 15 | 1996 | H6SD00077 | False | P | [1996, 1998] | 01 | 1 | [00] | [1996] | False | 1995-10-02 | True | None | C | Challenger | 1995-10-02 | 1995-10-02 | 2002-04-03T00:00:00 | ABBOTT, JAMES W | H | House | DEM | DEMOCRATIC PARTY | SD |
| 16 | 1988 | S6CA00345 | False | N | [1986, 1988] | 00 | 0 | [00, 00] | [1986, 1988] | False | 1988-05-16 | True | None | C | Challenger | 1988-08-29 | 1988-08-29 | 2005-05-26T00:00:00 | ABBOTT, JOHN HANCOCK | S | Senate | DEM | DEMOCRATIC PARTY | CA |
| 17 | 1992 | P80002579 | False | P | [1988, 1990, 1992, 1994, 1996, 1998] | 00 | 0 | [00, 00] | [1988, 1992] | True | 1988-08-29 | True | None | C | Challenger | 1992-06-16 | 1992-06-16 | 2002-04-03T00:00:00 | ABBOTT, JOHN HANCOCK | P | President | DEM | DEMOCRATIC PARTY | US |
| 18 | 2004 | H2TX18082 | False | P | [2002, 2004] | 18 | 18 | [18, 18] | [2002, 2004] | False | 2002-03-12 | True | None | C | Challenger | 2002-03-12 | 2002-03-12 | 2005-03-02T00:00:00 | ABBOTT, PHILLIP J. | H | House | REP | REPUBLICAN PARTY | TX |
| 19 | 2000 | H4KY03095 | False | P | [1994, 1996, 2000] | 03 | 3 | [03, 03, 03] | [1994, 1996, 2000] | False | 1994-05-11 | True | None | C | Challenger | 2000-05-25 | 2000-05-25 | 2002-04-07T00:00:00 | ABBOTT, RAYMOND H | H | House | DEM | DEMOCRATIC PARTY | KY |
data["results"][0]["name"]
'AADLAND, ERIK'